The mid-latitude storms would sometimes come like beads on a string, one right after another, stalling the research team’s efforts to deploy the critical ocean-monitoring instruments that sat secured on the deck of the 273-foot Roger Revelle.
But despite the barrage of cyclonic storms, science prevailed. Using sophisticated equipment that ranged from underwater gliders and surface drifters to moorings and a state-of-the-art instrument called a Wire Flyer, University of Miami oceanographer Lisa Beal and a group of more than two dozen researchers amassed a trove of new ocean data in a region of the Southeastern Atlantic Ocean called the Cape Cauldron, bringing them a step closer to understanding the ocean’s role in climate change.
“The Cape Cauldron is one of the ocean’s most energetic regions, full of spinning eddies and meandering filaments that vigorously stir and mix warm salty Indian Ocean waters into the cold Atlantic,” explained Beal, a professor of ocean sciences at the University’s Rosenstiel School of Marine, Atmospheric, and Earth Science, who led a recent 26-day research cruise to that basin.
Scientists are not sure how the flow of waters from the Indian Ocean into the Atlantic has been changing. But solving that mystery is vital, Beal noted, because the enormous flux of energy—heat, salt, and momentum—associated with all that stirring and mixing can have far-reaching consequences on global weather and climate.
“How that energy flux is changing is the big question because it can affect Atlantic Meridional Overturning Circulation (AMOC),” said Beal, referring to the conveyer belt-like system of ocean currents that circulate water within the Atlantic, bringing warm water north and cold water south.
“The choke point where Indian Ocean waters come around South Africa and leak into the Atlantic is a return flow; it feeds the AMOC,” Beal explained. “So, if we have more salty Indian Ocean waters coming into the Atlantic, they can increase density and result in more overturning. And if you have more overturning, you have greater heat transport to the north, arguably resulting in more ice melt in the Arctic.”
Thirty scientists representing 10 nationalities and hailing from five institutes across the United States, Europe, and Africa embarked on the Beal-led cruise, making thousands of observations to quantify interocean fluxes in the Cape Cauldron.
The instruments they deployed on the nearly monthlong National Science Foundation-funded expedition made those observations possible, with University of Rhode Island researcher Chris Roman’s Wire Flyer being one of the most high-tech tools of the many devices used while at sea. The ocean-sensing instrument is towed by a ship and is designed to quickly slide up and down a wire in the water column, profiling the ocean at unprecedented resolution.
The Rosenstiel School team aboard the Scripps Institution of Oceanography’s ship Revelle—Beal; researchers Guillaume Novelli, Eduardo Jardim, and Cedric Guigand; and doctoral students Rachel Sampson and Paloma Cartwright—deployed moorings and surface drifters.
With 50 different types of instruments attached to them, each of the two 4,500-meter-long moorings captured interleaving and eddy fluxes of warm, salty Indian Ocean and cool Atlantic waters. The Rosenstiel School team positioned one of their moorings below a crossover point of NASA’s new SWOT satellite, allowing the team to relate ocean eddy fluxes to patterns and changes in sea level, according to Beal.
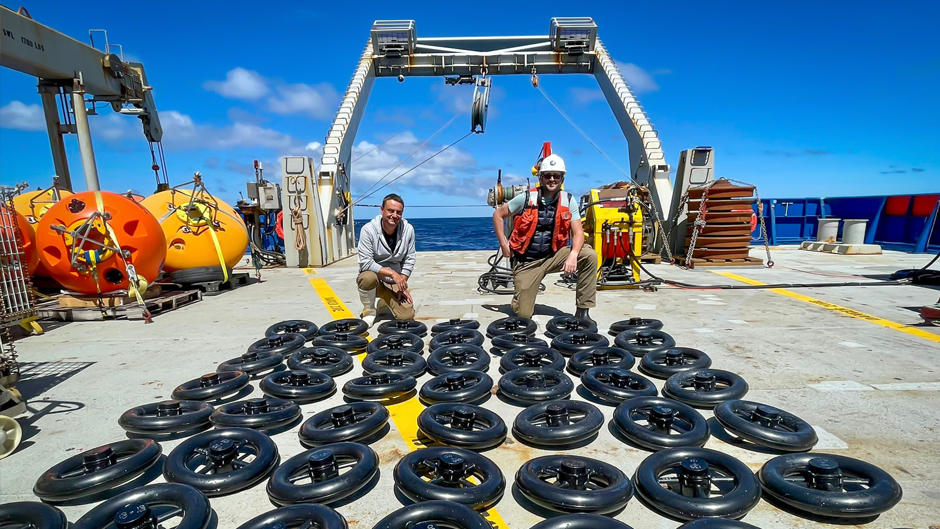
Working with other team members, Guigand released 200 surface drifters into the water. The devices, which he helped design at the Rosenstiel School, immediately started tracking eddies and filaments of Indian Ocean water.
“These kinds of measurements had not been attempted before in such a highly energetic region of the ocean, and we had a lot of challenges because of that,” said Beal, noting that storms sometimes prevented the deployment of instruments.
To overcome those challenges and to optimize sampling, Beal and other team members studied satellite data and forecast models for the Cape Cauldron, adapting their cruise plan daily.
“It was an intense cruise and, for me, personally, the best experience I’ve ever had at sea,” Beal said. “A lot of that had to do with the fact that the other two co-principal investigators on the cruise, Kathy Donohue, [a professor of oceanography at the University of Rhode Island], and Yueng-Djern Lenn, [Bangor University physical oceanographer], are good friends of mine. We’ve known each other for 20 years and supported each other through many challenges during our careers. It’s rare for women scientists to lead a research cruise of such importance.”
For doctoral students Sampson and Cartwright, who assisted in deploying the instruments, the expedition offered an unmatched experience for their still-fledgling academic careers.
"Seeing women in STEM taking charge and running the show inspired me,” Sampson said.
“This team came together seamlessly to ensure that everyone got to actively participate in the science,” said Cartwright. “And most importantly, the cruise gave me a new love and respect for the ocean and the scientists who study it.”
Now, the data analysis begins. Even employing an efficient strategy of collaborating with other researchers, it still will take years to analyze the tremendous trove of information collected from the cruise and to report “the new science,” Beal said. “We’ve got so many different measurements of several different phenomenon. We’re still in the processing stage, trying to clean up the data and get it into a state where we can use it.”
