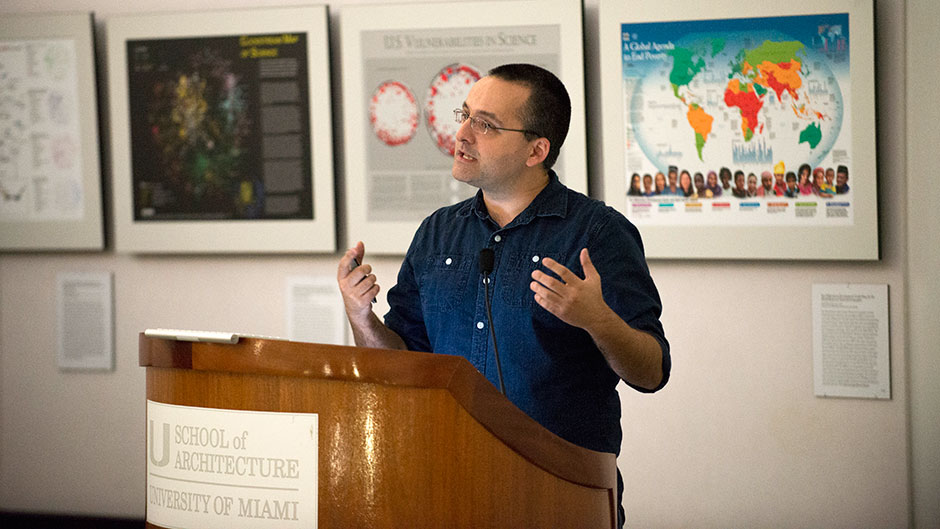
Places & Spaces: Mapping Science, the extraordinary Indiana University exhibition of 100 artistic big-data visualizations that debuted on the University of Miami campus in September, held its capstone event last week. But it signaled a beginning, not an end.
“There are no endings,” said Sawsan Khuri, chair of the Places & Spaces committee and director of engagement for the Center for Computational Science (CCS), which joined with the College of Arts and Sciences, School of Communication, School of Architecture, and Otto G. Richter Library to bring the exhibit to campus. “Places & Spaces may be leaving, but this is also the beginning of VizUM, a visualization project that will connect the visualization efforts already in place on the campus and initiate new efforts as well.”
During Places & Spaces’ four-month stay, the Places & Spaces committee hosted a wide range of data visualization events themed around art, business, humor, science, and more. The committee also involved the Lowe Art Museum and introduced the local community to Places & Spaces by jointly hosting a family day, a teacher-training day, and a Girl Scouts badge opportunity that drew more than 30 girls to campus.
Held December 11 in the Stanley and Jewell Glasgow Hall, the capstone event began, as most of the events did, with “opening acts,” which Khuri describes as “student-created, <i>New York Times</i>-level, widely engaging visualizations, explained in one sentence.”
Chance Scott, a graduate student in geography, detailed accident density for Miami-Dade County from 2003 through 2010; Julius Dewalt, also a grad student in geography, illustrated the mosquito-borne distribution of malaria in Mali; and undergraduate Luis David Real showed the growth of Hispanic populations in Georgia, county by county, from 2000 through 2010.
Faculty speakers were Ju Hong Park, assistant professor in the School of Architecture, Victor Milenkovic, computer science professor in the College of Arts and Sciences, and Alberto Cairo, assistant professor in the School of Communication and director of CCS’s Visualization Program. They discussed how visualization, through digital modeling and 3-D printing, can improve everything from the treatment of injuries caused by improvised explosive devices to the use of real estate.
“It works better to understand something if you engage with it, if it uses your hands as well as your eyes,’’ Milenkovic said, explaining his love of interactive visualization. “Visualization should be 3-D in space and 1-D in time.” He detailed plans for the new Human Computer Interaction and Visualization laboratory that the Center for Computational Science is installing at the Ungar Building, which will include a video wall and a 3-D screen.
Describing visualization as the “visual representation of any information to clarify it,” Cairo said VizUM is an important initiative because data visualization and infographics are going mainstream and, as visualization tools become easier to use, will continue to grow in popularity. He urged University departments and faculty already involved with visualization to talk to each other to develop effective visualization methods that the general public can use.
“We have oceans of data. We need new ways to deal with it,” he said. “VizUM will become a means of getting in touch and keeping an eye on what’s happening at UM,” Cairo said.
For more information, visit CCS’s visualization website at http://visualization.miami.edu.

