If you’ve ever spent time analyzing financial reports at a corporate meeting, or analyzing reports from the U.S. Bureau of Labor Statistics, you likely enjoy the process more when the data is accompanied by interactive graphics to illuminate key findings.
Yet who exactly conceives and creates all of the detailed charts, maps, and info-graphics that appear regularly in newspapers to break down complex topics such as The New York Times report on refugee distribution across Europe? Or websites that provide real-time data about police shootings across the USA such as The Counted, or global warming facts via an animated timeline in the Bloomberg Business report What’s Really Warming the World?
“Data visualization” is at the core, and it is a burgeoning field of study at the University of Miami and other top academic research institutions.
From devising app-based tools, to organizing vast scientific datum into bite-size morsels, data visualizers often begin their career journey as computer scientists, journalists, academic researchers, coders, or graphic designers.
The common thread is that they have all developed a keen interest in recasting complex data in visually appealing ways to broaden the understanding of the world in which we live.
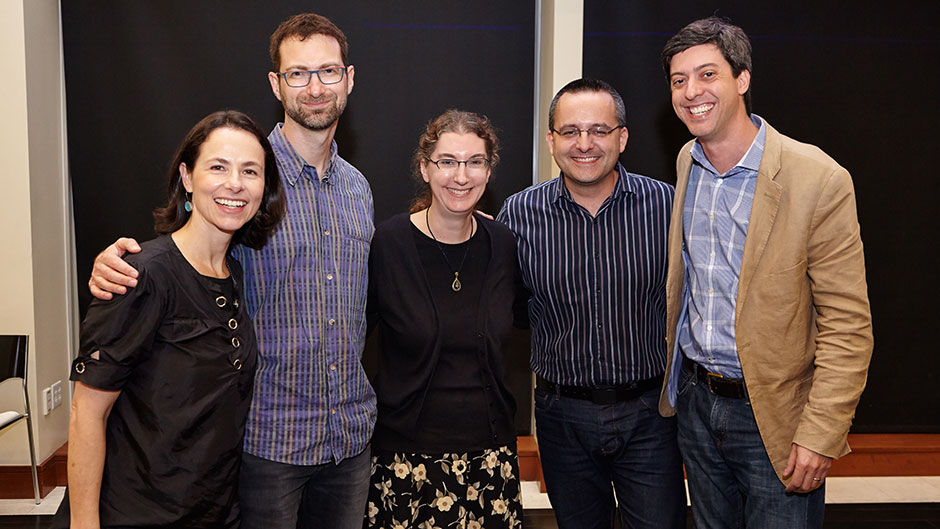
Infographics and Data Visualization were the topics at the University of Miami’s second annual VizUM Symposium held on November 12 at the University of Miami. Dubbed a “data visualization celebration” by UM’s Center for Computational Science, which hosted the event at the Newman Alumni Center, VizUM attracted about 100 students, alumni, faculty, and community members for a highly engaging and informative symposium, followed by a networking reception.
Featured speakers were Lynn Cherny, Visiting Knight Chair for the UM Center for Communication, Culture and Change who spent 18 years as a user interface designer and manager at AT&T, Adobe, TiVo, and Autodesk; as well as Fernanda Viegas and Martin Wattenberg, leaders of Google’s “Big Picture” data visualization research group that “invents new ways for people to understand and explore data.”
Thanks in part to modern browsers, increased practice of JavaScript and HTML5, the field of data visualization is growing, according to Alberto Cairo, Knight Chair in Visual Journalism for UM’s School of Communication who introduced the guest speakers. Cairo shared that when he started his career in 1996 as an infographics designer for a newspaper in Spain his father had never heard the term. “He kept asking when my byline would appear with a story. It was a craft done by a minority then. But now it is mainstream.”
Visiting professor Lynn Cherny gave a concise overview of how the world of data visualization has progressed from early “stepper” tools (sequentially numbered slides that users control to advance a series of diagrams), to new styles of data visualization including “scrollytelling” (animated data on a moveable timeline: http://ghostweather.slides.com/lynncherny/)
She summarized that in the end, like good journalism, “It’s about story-telling. It’s about making it personal.”
Fernanda Viegas and Martin Wattenberg from Google’s Big Picture Group suggested that data visualization helps people think collectively, and move beyond numbers into the realm of words and images. “Good visualization will give you a chance to ask questions you didn’t ask before,” explained Martin Wattenberg.
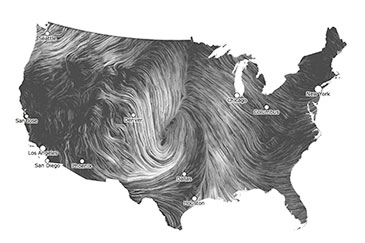 For example, imagine that you want to crunch a huge amount of wind pattern data from the National Digital Forecast Database and then animate it on a real-time map of the world, which needs to load quickly on a website or mobile device. That is where data visualization technologists come in, and that is exactly what Viegas and Wattenberg accomplished during a recent Wind Map project.
Wattenberg joked that before they created the Wind Map, he was under the impression that the wind basically moved from West to East across the United States. But he said that after creating the Wind Map, they were amazed at the number of complex patterns that emerged visually. “We immediately had questions, such as why are the Rocky Mountains always distorting the wind?” said Wattenberg.
The Rockies aren’t that large, but they have enormous impact on the country’s wind patterns.” The team has also archived a mesmerizing gallery of past hurricanes on their site http://hint.fm/wind/.
“We are not looking for a specific ‘answer’ but want to interpret the data enough to ask more questions,” said Viegas.
Their team has also developed a new app for mobile devices called Explore that automates charts and graphs from spreadsheets created in Google Sheets. After auto-analyzing the data, the app provides text annotation that suggests trends and other key observations. It is available in 68 languages.
VizUM was sponsored by the Knight Foundation, UM’s Center for Computational Science, UM College of Arts & Sciences; and the UM School of Communication Center for Communication, Culture and Change.